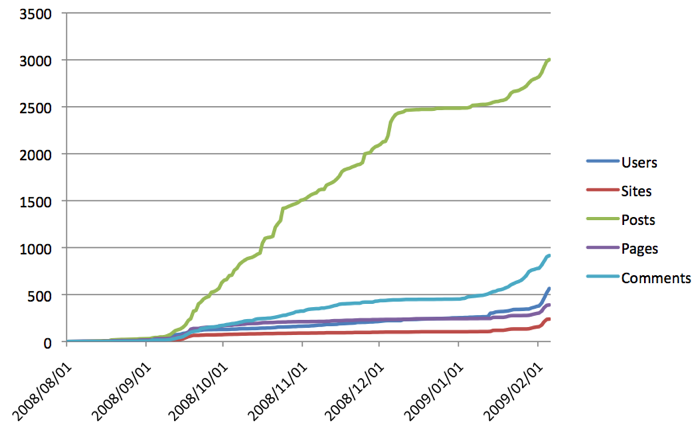
I spent some time this afternoon poking around in the database that runs UCalgaryBlogs.ca to see if I could get a better sense of how it’s growing. Turns out, it’s growing MUCH faster than I thought it was (and I thought it was growing pretty darned fast).
It’s still pretty small scale, compared with giants like WordPress.com and Edublogs.org, but the growth looks pretty much exponential. I’m glad we’ve got lots of room to scale this puppy. And that campus IT isn’t upset with growing demands on database resources.

Kudos! Really great to see that after all these years we;re making progress. The thing I love to see in these graphs aside from posts are comments. When people start to realize that there are real people around them writing good things happen. Great stuff … too bad we didn’t get to talk about this at ELI! Perhaps next year I can actually make it to NV?
D’Arcy, why do you think this one’s going so much “better” than the last attempt? Platform? Timing? Marketing?
That’s a nifty graph, how did you make it? Is this data premised on the plugin you designed, or is it a new way at the info? Inquiring minds want to know, and go, go, gadget blogs!
@cole – the commenting activity is the coolest part. it started out slowly, but the students are starting to become much more active on _each other’s_ blogs. very cool stuff. I’m going to start buying lottery tickets to see if I can make it to ELI 2010, but will be talking about this at NV’09 (and maybe update for NV’10 🙂 )
@paul – I don’t know for sure, but my gut tells me it’s a mixture of timing (blogging isn’t a strange new thing anymore), more appropriate environment (WPMU gives each student their own spaces, as well as groups and classes, and they can do whatever they want without feeling like part of a commune), and some faculty members who are really wanting to explore this as a resource. It’s certainly NOT marketing that’s making a difference, at least directly with students (aside from a dozen or 2 posters I slapped up last semester, which were quickly overgrown by other posters)
@jim – it’s loosely based on that script, but I had to do a LOT of manual and code-based wrangling to get the numbers I wanted. I’ll spend some time trying to figure out how to automate that. The first script I wrote records snapshots of the data for easy graphing, and the ones I used for this graph mine the live database to generate historical data.
Congratulations on your achieved virality, no matter if you know the reasons why or not. Now you have to read all of those posts and blog them like the good @Reverend 😉
I’d haard a guess there is a tipping point / inflection for comments where people who start getting them feel the natural (I hope) reflex o comment more.