fun with bike data visualization

I just picked up a license for the fantastic OmniGraphSketcher application. I’m using it to build the visualizations for my thesis, and wanted to see what it would do with my bike tracking data. OK. I was procrastinating, and couldn’t force myself to work on the thesis. But, at least I’m learning how to do more cool stuff with data, right? cough

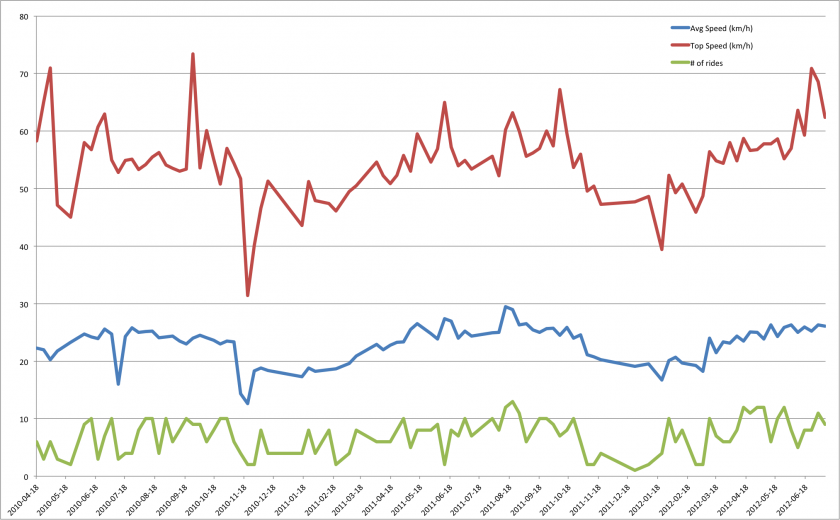
Anyway. Here’s a visualization of almost 2 and a half years of data stored in Cyclemeter on my iPhone. I exported the activity history in monthly aggregate, and took the .csv file into Excel to select the rows, which were then pasted into OmniGraphSketcher. The visualization shows total distance (divided by 10, so the distance data points fit in the same range as speed data), average speed and maximum speed per month. I also overlaid lines to show which bike was being used. The Kona wound up being my winter bike, and my Cannondale is my fast summer bike. It’s pretty easy to see where the snow and ice crapped up my rides 🙂

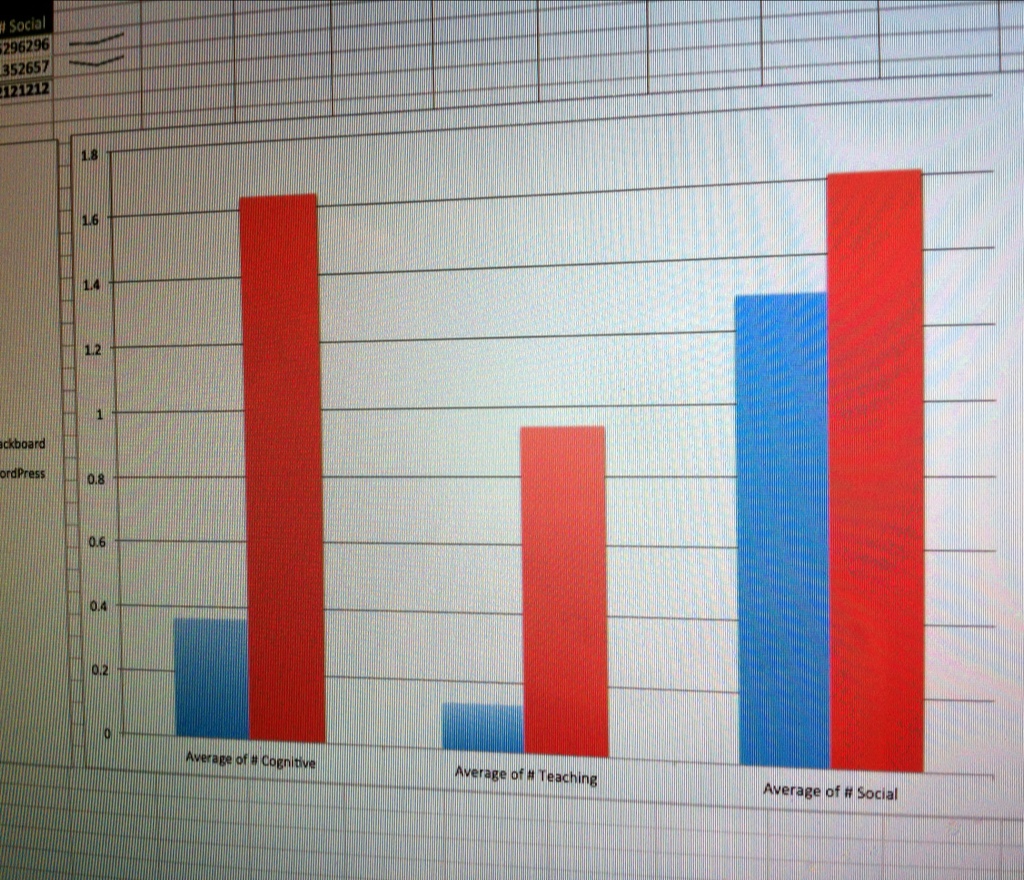
compare the OmniGraphSketcher graphic above, with one I created directly in Excel back in July:

excel ride data visualization

discussion visualization with gephi

I’ve been playing around with gephi today, to see what I could come up with to display the discussion threads from my research data. Lots of manual data entry later, and I’ve got this:

and this:

WordPress sites are shown in red, Blackboard discussion forums in blue. So far, just a pretty picture, but I’ll hopefully be able to coax out a diagram or two that shows the difference in interaction patterns between the two platforms…

full online discussion metadata visualization

I’ve finally entered all of the metadata information for the online discussions I’m using in my thesis. This includes the person who posts something, the date, and the size of the post. I worked through my earlier visualization mockup, and wanted to try it with the full set of data. So, here’s the Blackboard discussions (top image) and WordPress blog posts (bottom image):


It’s only the most basic of metadata, but already differences in activity patterns are becoming apparent. Both images are on the same time- and size- scales. The WordPress discussions appear to be using significantly longer posts and comments, spread over much more time. Blackboard discussions appear to be shorter posts, over briefer durations.

Next up, I get to code each post for Community of Inquiry model “presences” – as described by indicators for social, cognitive and teaching contributions in the posts. I’ll figure out some way to overlay that information on top of the basic metadata visualization.